
Why is brand search getting more expensive in 2022?
Are your brand search campaigns becoming more expensive? You’re not the only one 2022 has seen skyrocketing CPCs …


Brand search ads tend to be cheap at a CPC level but the high volume of clicks for most large brands can result in a large spend. Incrementality testing is a great way of estimating the true value of your brand search campaigns, allowing you to make an informed decision about the amount of money you spend on this kind of marketing. For example, one brand we worked with had an annual spend of €500k for their brand ad campaign - through an incrementality test we found that only 11% of conversions were incremental and up to €445k could be saved through budget/bid decreases and exclusions of non-incremental audiences.
Hopefully you’re considering running a test on your brand search ads and are looking for some information to get you started. There are many approaches you could take, depending on the circumstances of your campaign. Information about each approach is spread out across multiple resources and these often use language that is heavily technical and not so accessible to those working in the marketing field. We’ve created this guide for marketers as a comprehensive overview of each of our recommended method. This will point you in the right direction on designing, executing and analysing a brand incrementality test. There are a number of approaches included here that work for a variety of businesses and requiring varying levels of technical ability. So whether you work purely in marketing, or have some experience with coding and statistics, at the end of this article you will have a good idea of the next steps to take for you.
Firstly, let’s clarify the goal of incrementality testing, and the output we aim to get.
The goal of these tests is to estimate the impact on conversions as a result of brand campaigns being active. This is usually represented by an average number of conversions gained (or lost) over a period (e.g. an hour or day) as well as the % of last click conversions that are incremental.
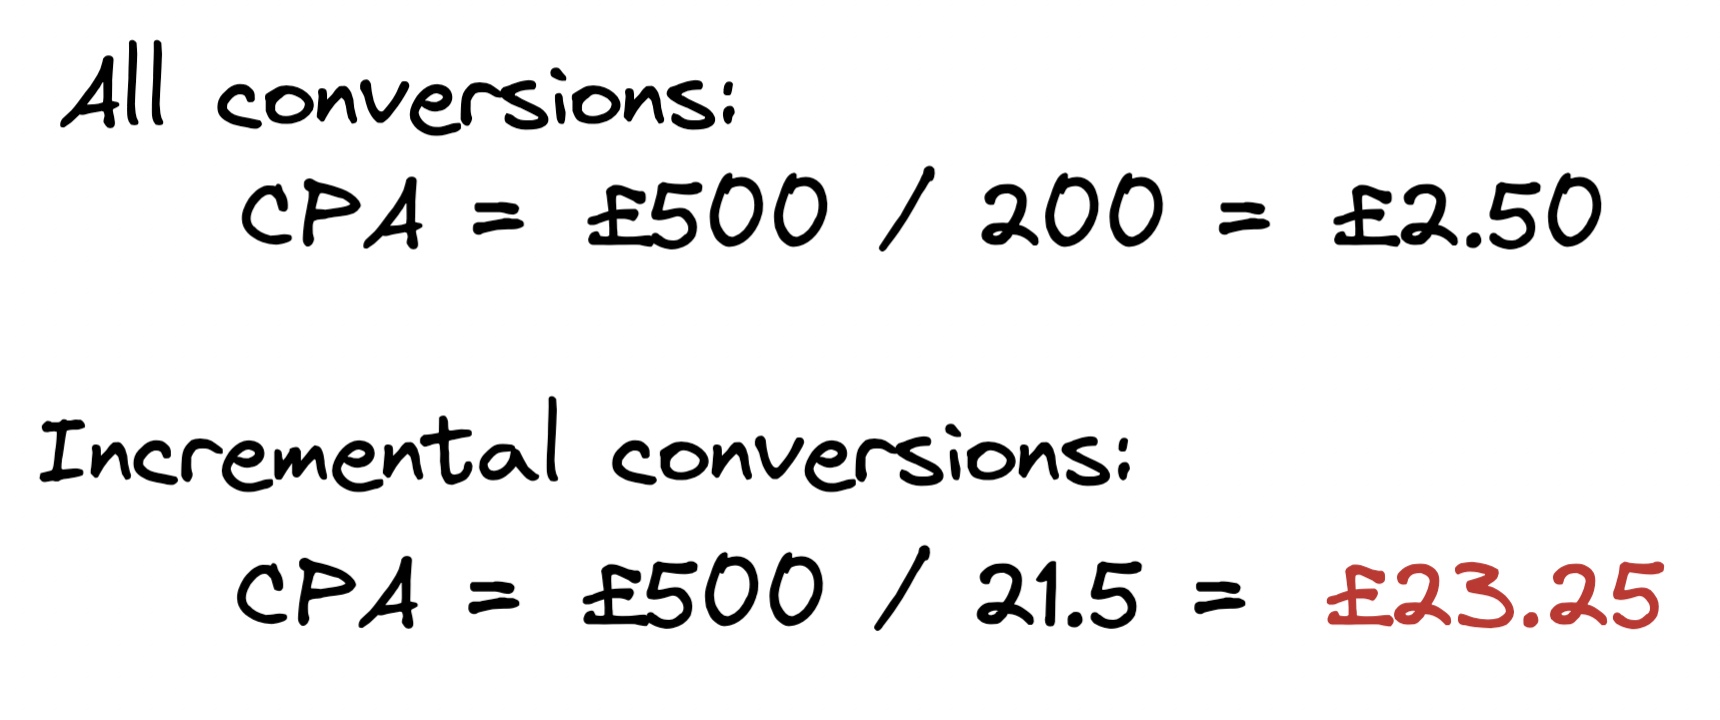
For example if a campaign reported 200 conversions per day, and the incrementality test found that the incremental value was 21.5 conversions on average, we could report this as:
From this we could also calculate the cost per incremental conversion (CPiA). If the campaign spends £500 day the CPiA would be £23.25
 CPA vs CPiA
The goal of an incrementality test is not to save money - although that may be the reason for carrying out the test, and an outcome of finding a low incrementality. Carrying out the test in an unbiased way is crucial. The goal is also not to speculate on why on why a campaign might be incremental or not, although it may provide some hints as to why that is the case
Estimate the incrementality in purchases is usually the objective - as that the ultimate goal for most businesses. However you could do this for any conversion or micro-conversion. Conversions that happen in a short window are best to use with this testing as the impact on these is clearer. In some cases this means using bookings, trial optins or signups if a purchase is expected to happen more than 7 days after a click.
The volume of data is a key factor - if you have 100 purchases per day, a 10% uplift would be quite clear - however if you’re averaging 1 purchase a day it would be difficult to see changes in this metric. Using basket adds, signups or even traffic would add a lot of additional data if purchase data is sparse.
One of the hardest, and most important parts of incremental testing is deciding on which traffic you want to look at. When testing the incrementality of brand search campaigns, you want to only be looking at users searching for the brand to get clear results - an uplift in Facebook Ad users when the campaign is switched off is probably unrelated and will obscure the results. There’s no magic way to look at these users and creating a best estimate is the only option.
You should start by looking at your brand search SERP to get an idea of all the routes a user can get to your website. Then you will need to filter the data you are looking at to just these users - for example in Google Analytics this could involve creating segments for each source.
Some common examples of traffic coming from brand searches could be:
Links to social media pages often rank high for brand search terms. Organic social traffic is sometimes included in a brand incrementality test but I’d only recommend this if organic social activity is low - if you are regularly posting to a high reach then the impact of brand search users on traffic from this channel is likely to be low.
When trying to determine any causality, a controlled experiment is seen as the ultimate strategy. This would involve being able to control all of the impacting variables so that you can be more sure that any change in your dependent variable is caused by your independent variable. The closest we can get to this in marketing is an AB test, in which an audience is randomly split and given a different treatment - and while there are factors you can’t control (time, demographic) the random allocation of users to a group gets us a reasonably effective test. For brand search incrementality we don’t have the privilege of running a controlled experiment of any sort, so the methods we need to use fall into a category called quasi-experiments. These are test designs that best deal with non-randomised non-controlled environments, in a way that minimises any bias as much as possible. It should be noted that while these can produce reliable results, they may be influenced by factors outside of the test more than a standard AB test.
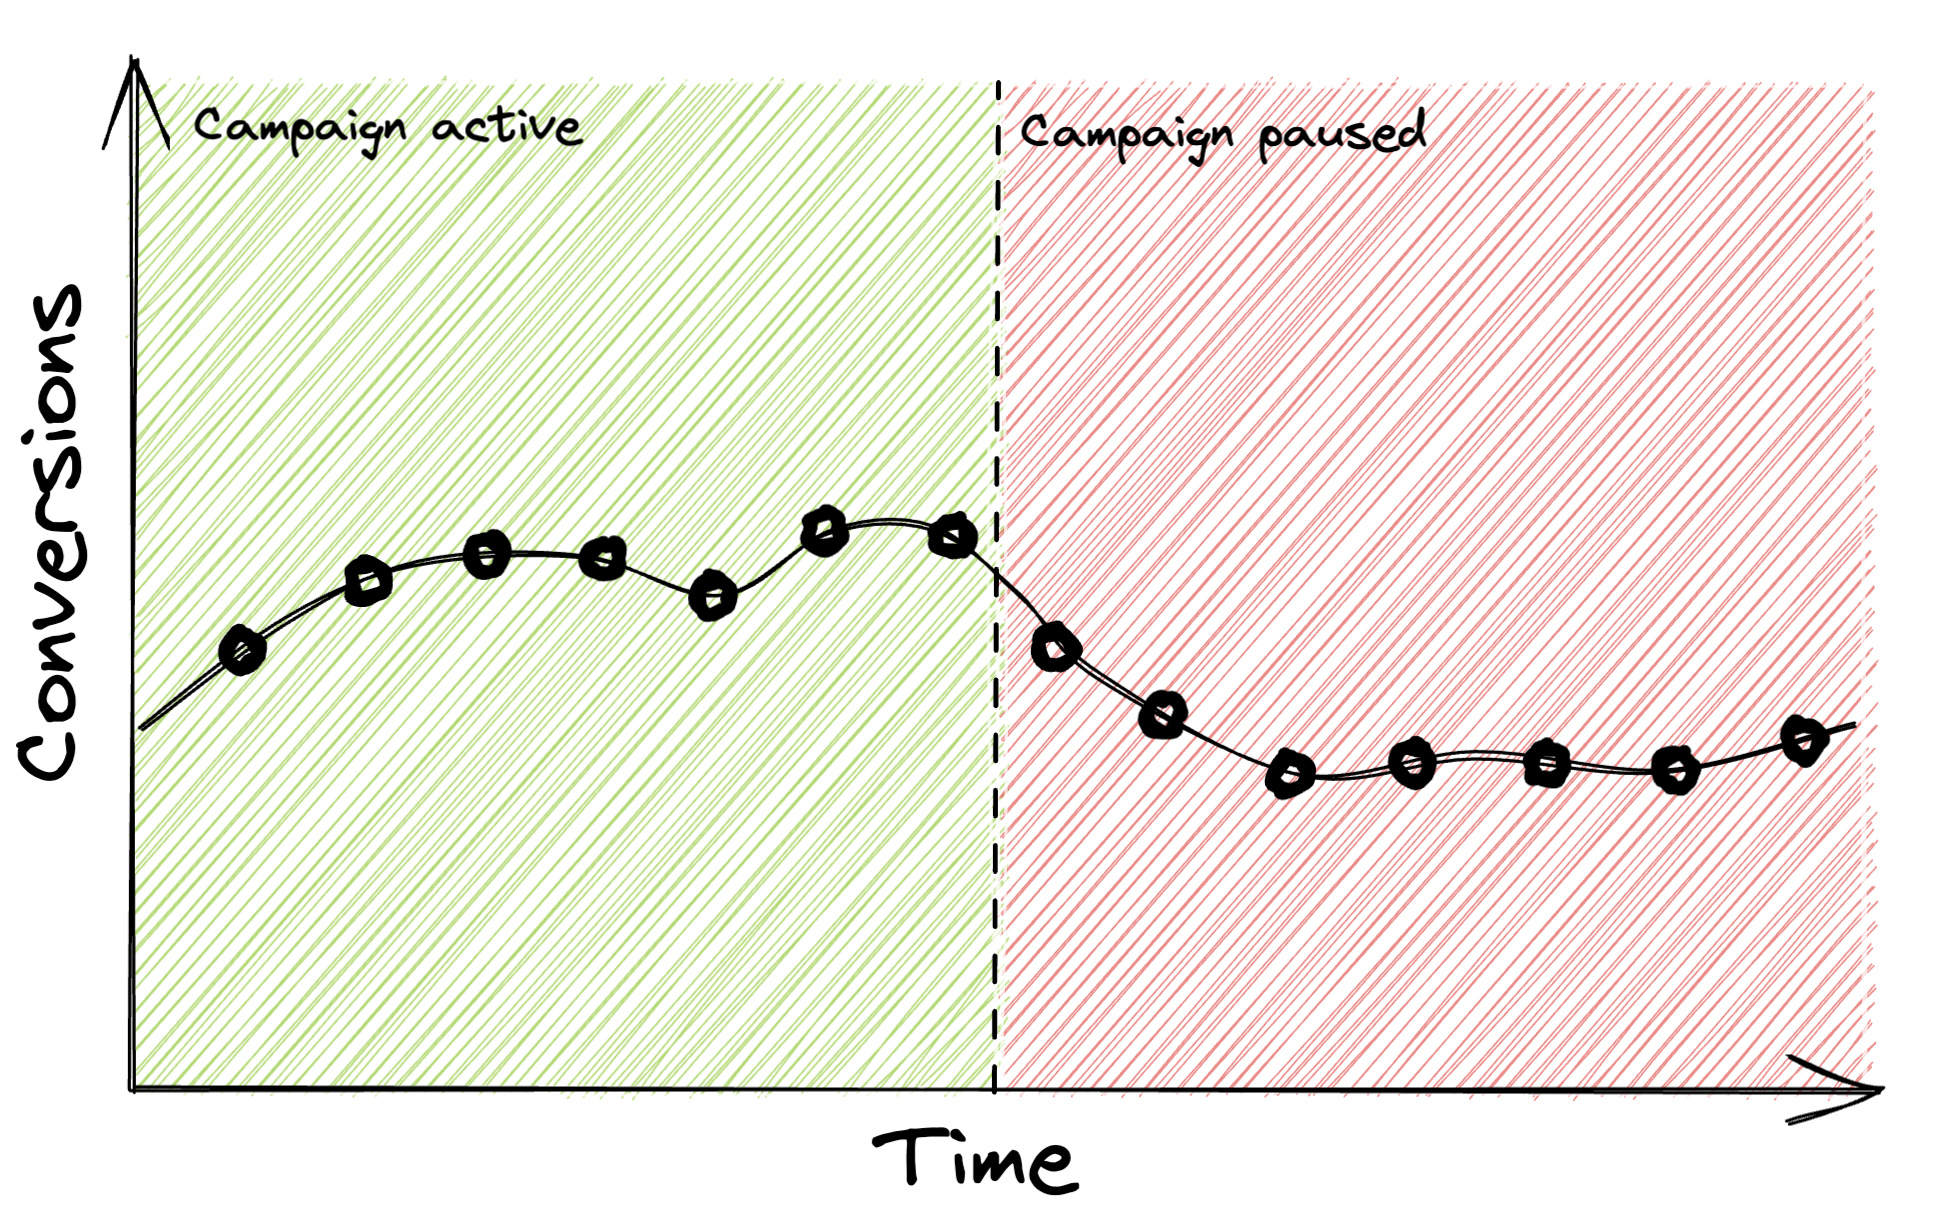 Chart with performance of a campaign that has been turned off
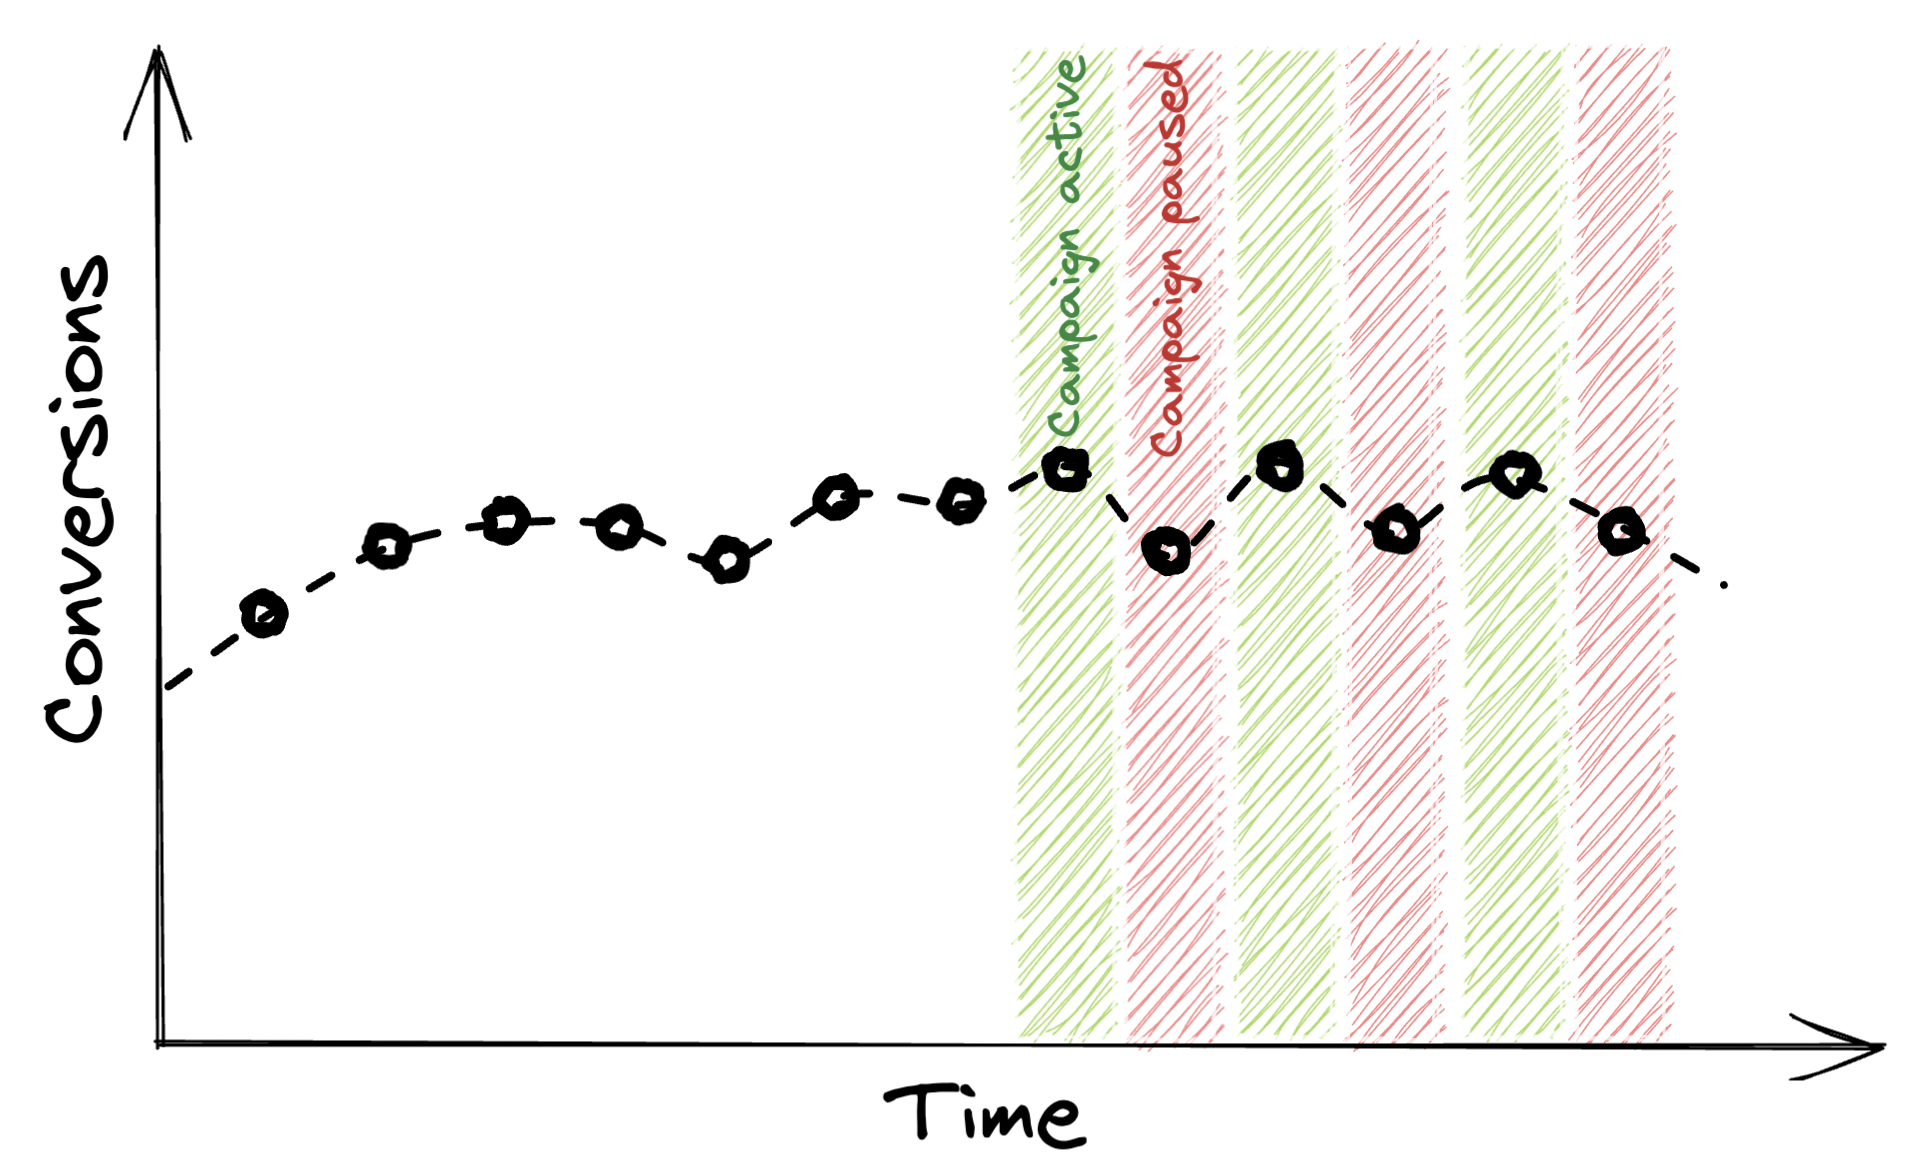
This is by far the simplest way to estimate incrementality - and while it may not be the most reliable method on the list, for most brands this will still give you a hint at the value of the campaigns.
This method basically involves switching off the campaign for a period of time and observing the conversions before and during the test. You can choose any period of time, aiming to cover at least 50 conversions, but including at least a week is recommended to avoid weekday seasonality impacting the results. The test (both the campaign on and off periods) should be over a period in which there are as few other factors that may also impact conversions - pausing the campaign over Black Friday week could make the incrementality of the brand campaign seem negative.
There are two ways to analyse the results, requiring varying degrees of technical work:
For example, if your brand search traffic has an average of 50 conversions per week, you could choose to switch the campaign off on Monday of one week, switching it back on the following Monday. The “campaign on” period would be the 7 days prior to the “campaign off” period. If you received 45 conversions during the “campaign on” period and 32 during the “campaign off” period you could estimate the incrementality as 13 conversions per week, or 28.89% of reported conversions.
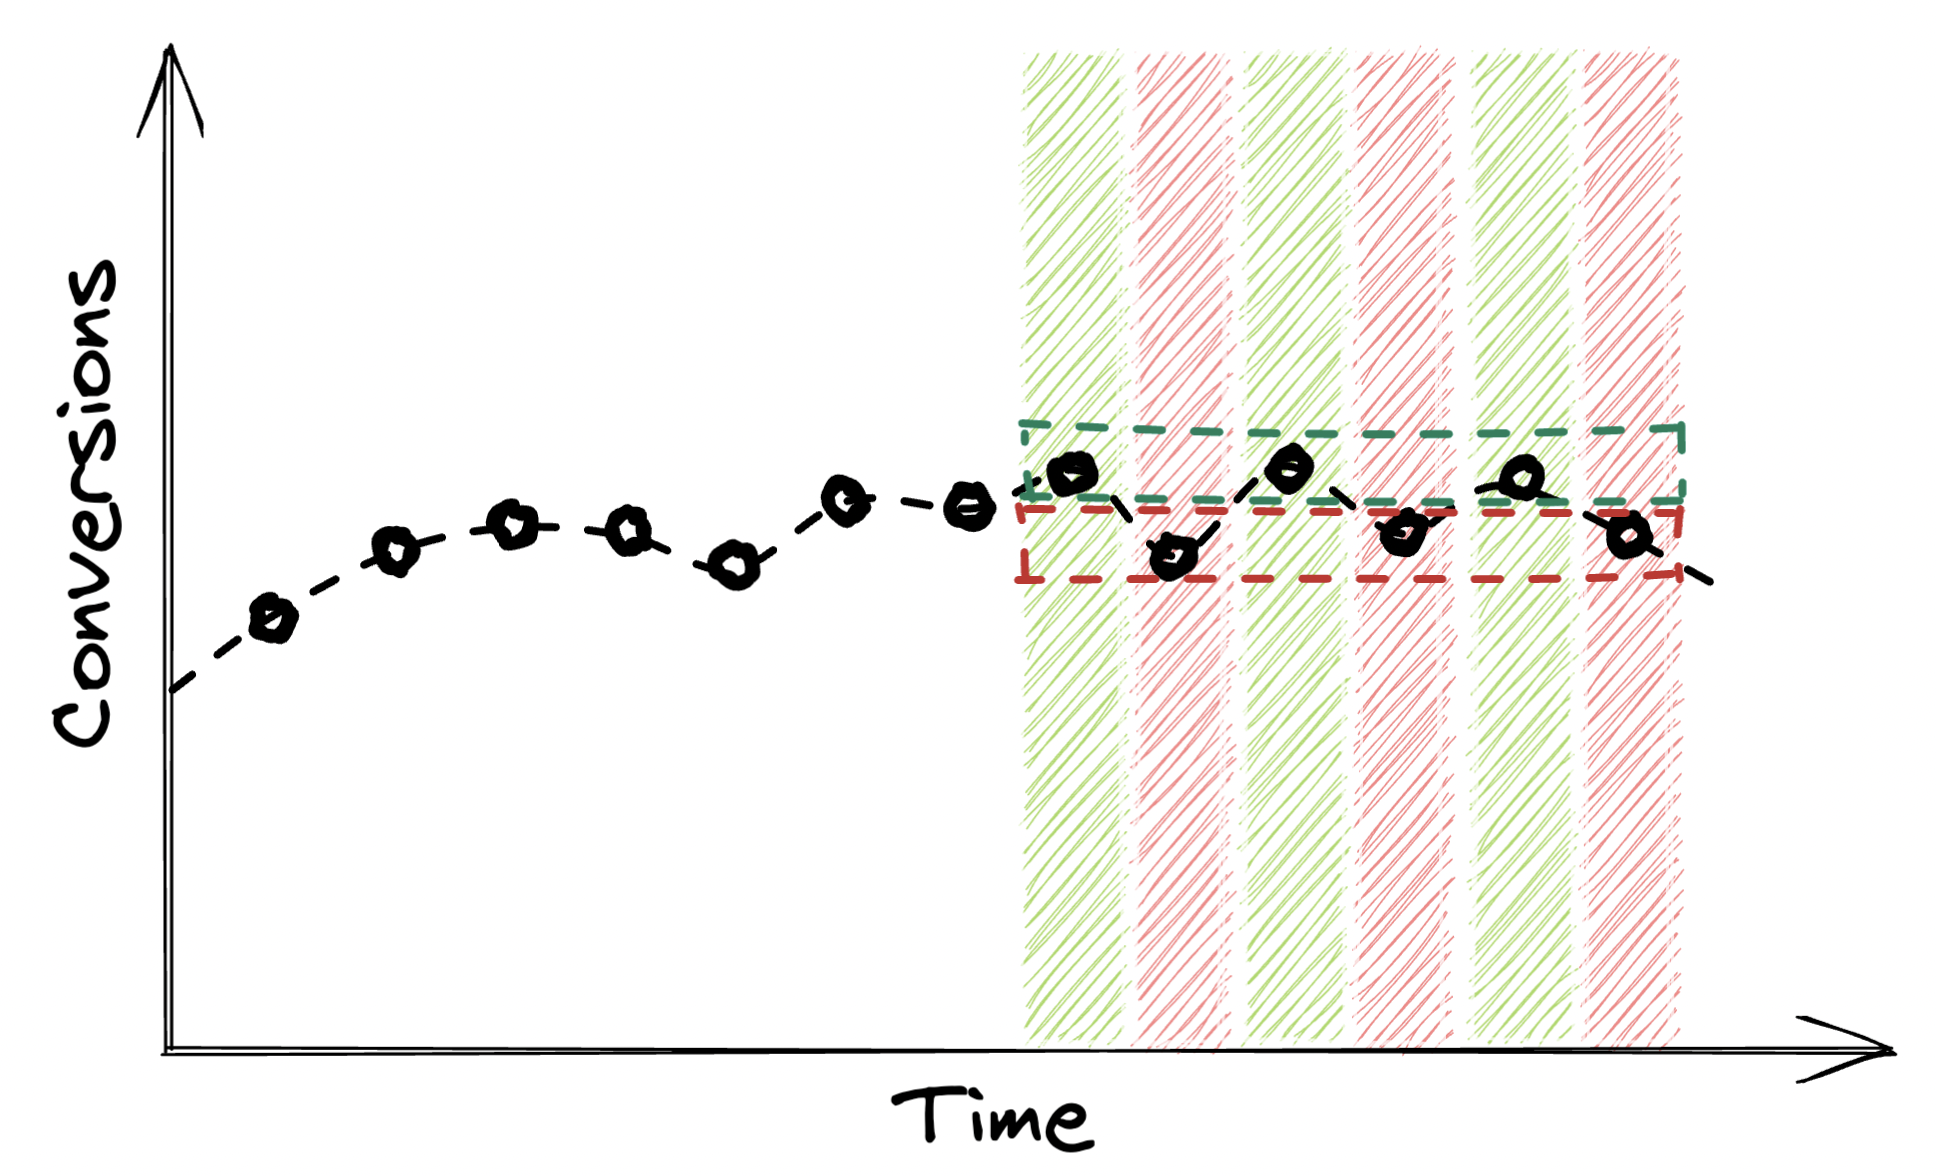
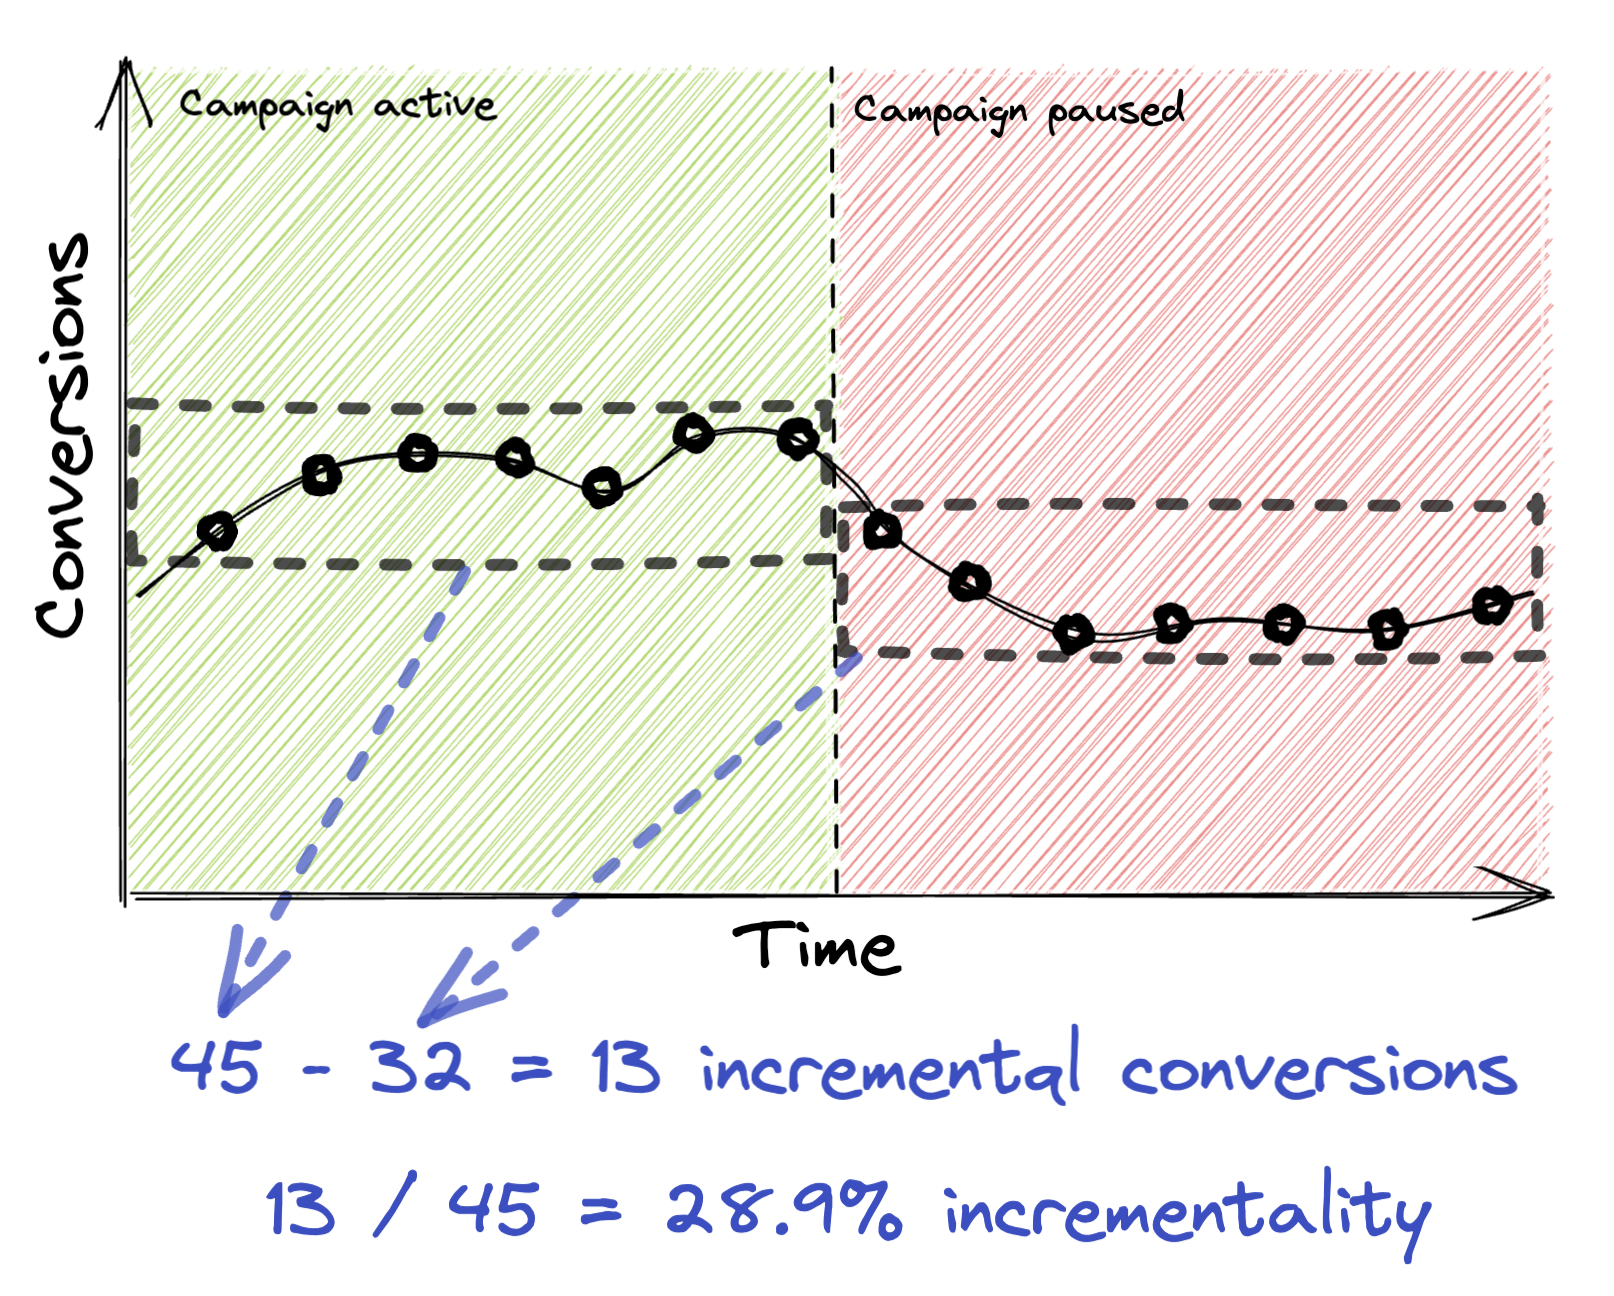 A simple comparison of performance
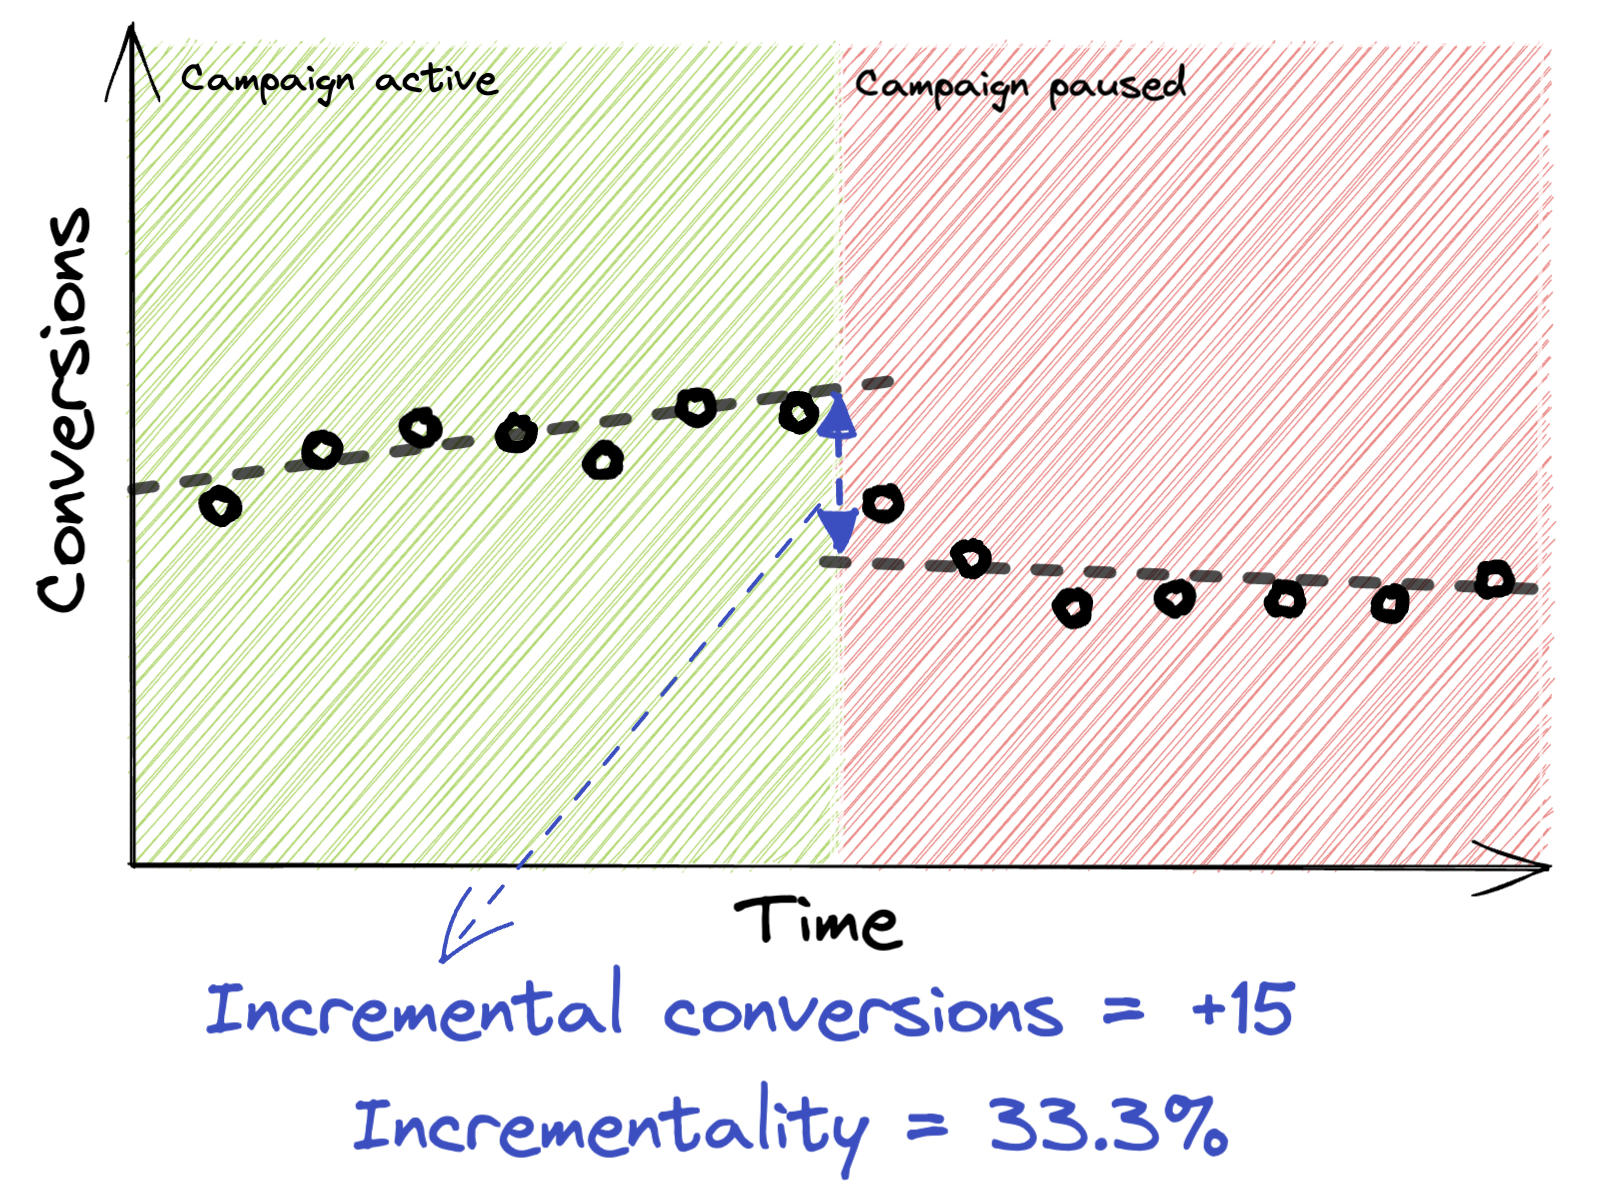 Regression Discontinuity Design
On the pros side, these methods are good because:
These methods do have significant drawbacks though:
If you have a low volume of sales and no budget to run anything more reliable this should still be good place to start to help you make decisions about your brand search ads. If you don’t have these limitations I wouldn’t recommend using these types of test - although these could be used as a way of convincing management to run one of the more sophisticated tests.
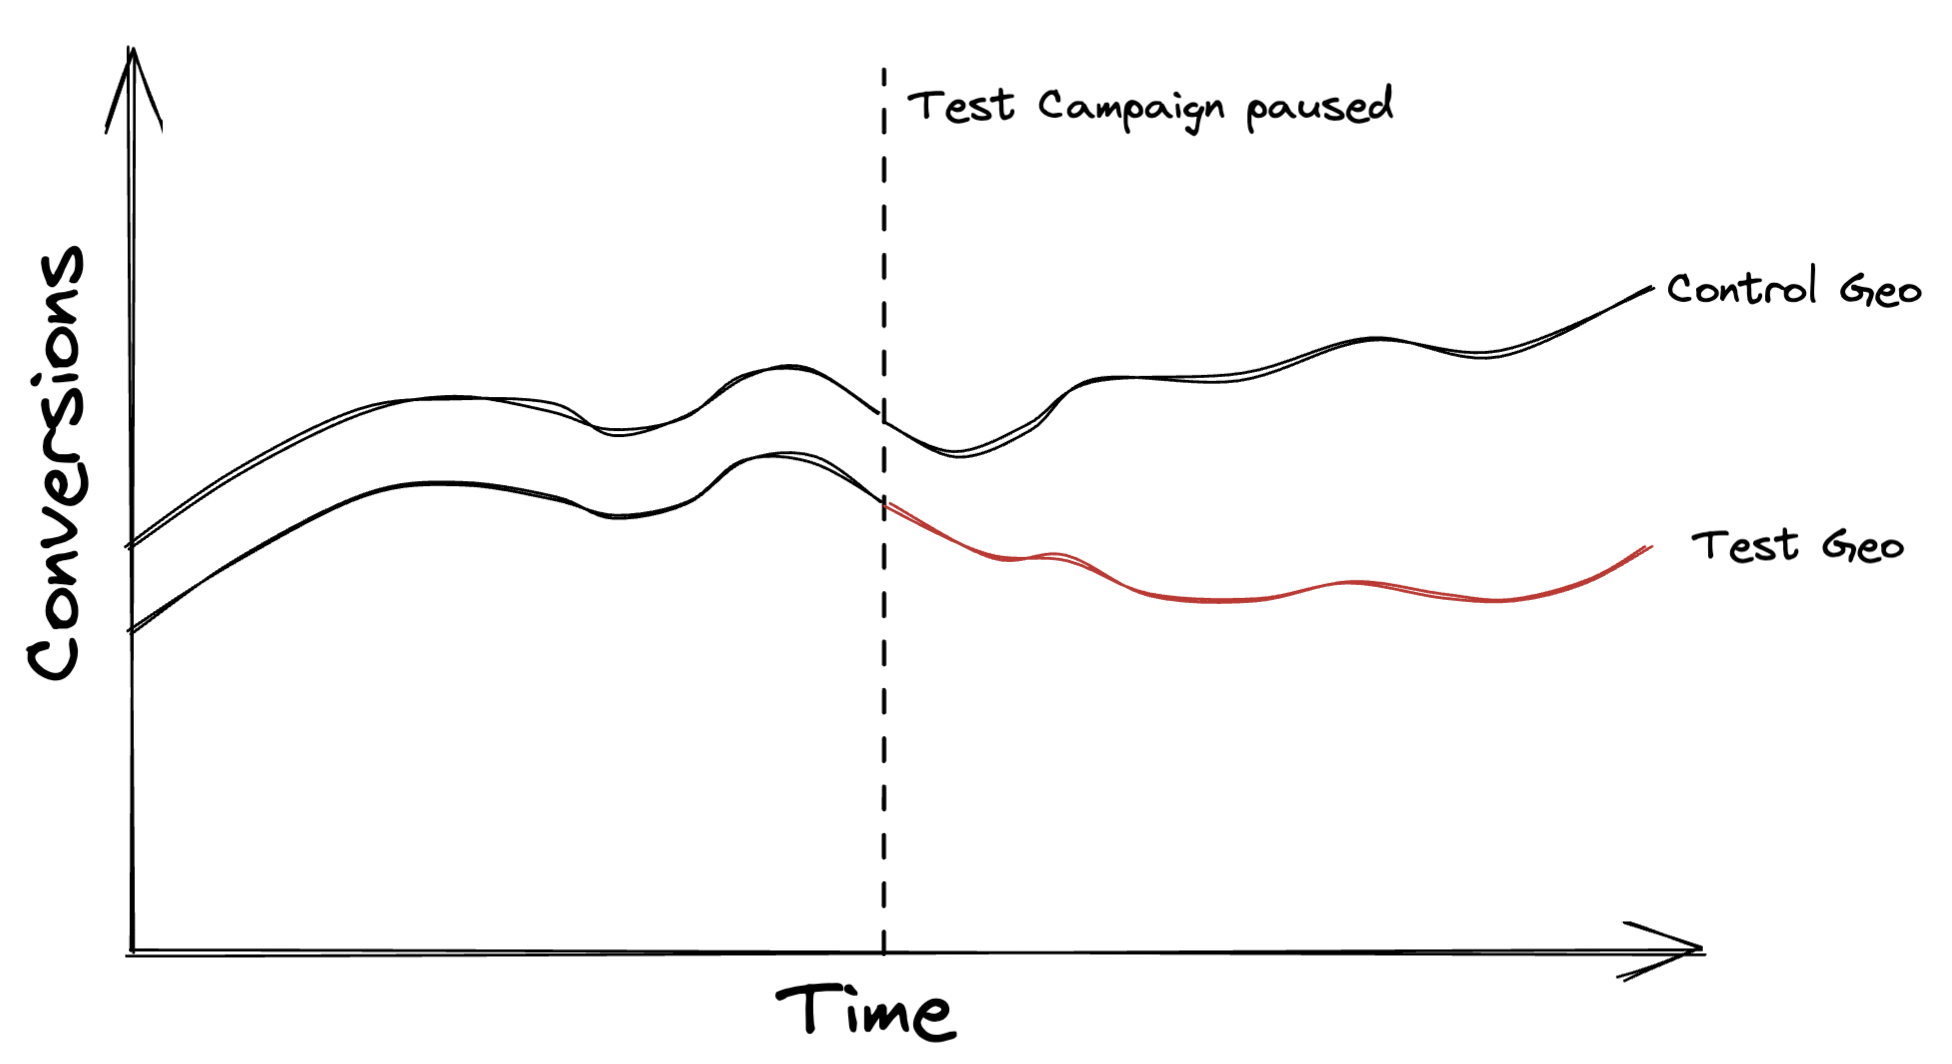 Chart of campaign performance in a geo test
This method involves finding two distinct geolocations that have users with similar traits and exposing them to different conditions. This test is the one that best avoids the impact of different factors occurring at different times, as each side of the test is running consecutively. As far as brand search incrementality tests go, this method is probably the most desirable - but it does have some very strict limitations.
For this type of test to work in practice, all of these factors need to be true:
If these are met then you first need to find one control and one test geo. This isn’t as simple as saying “Manchester and Liverpool are good because close together” - the geos need to have correlated behaviours. There are a number of ways you can find these areas, from the less-technical such as finding areas with similar CTRs, CPC and conversion rates, to more technical solutions such as finding the multicollinearity between areas with variance inflation factors. The areas don’t need to be identical in terms of volume, but should have similar performance metrics. Creating a better match will reduce noise and improve the clarity of your results.
Once you have these it’s time to run the test - choose a period to test, and switch off the brand ads in your test geo. The test length depends on the volume and variance of data. Similar to the previous test type - I’d recommend testing in increments of 7 days to iron out any weekday seasonality impact. 14 days is often the sweet spot for most brands, but if your conversions are low (<50/week) then extending this to 28 days should give you enough data.
After the test has run you’ll have a dataset of conversions over time for your test and control geo. There are a couple of ways to extract incrementality from this - stretching from non-technical to technical. Using a more sophisticated approach can increases the reliability of your findings.
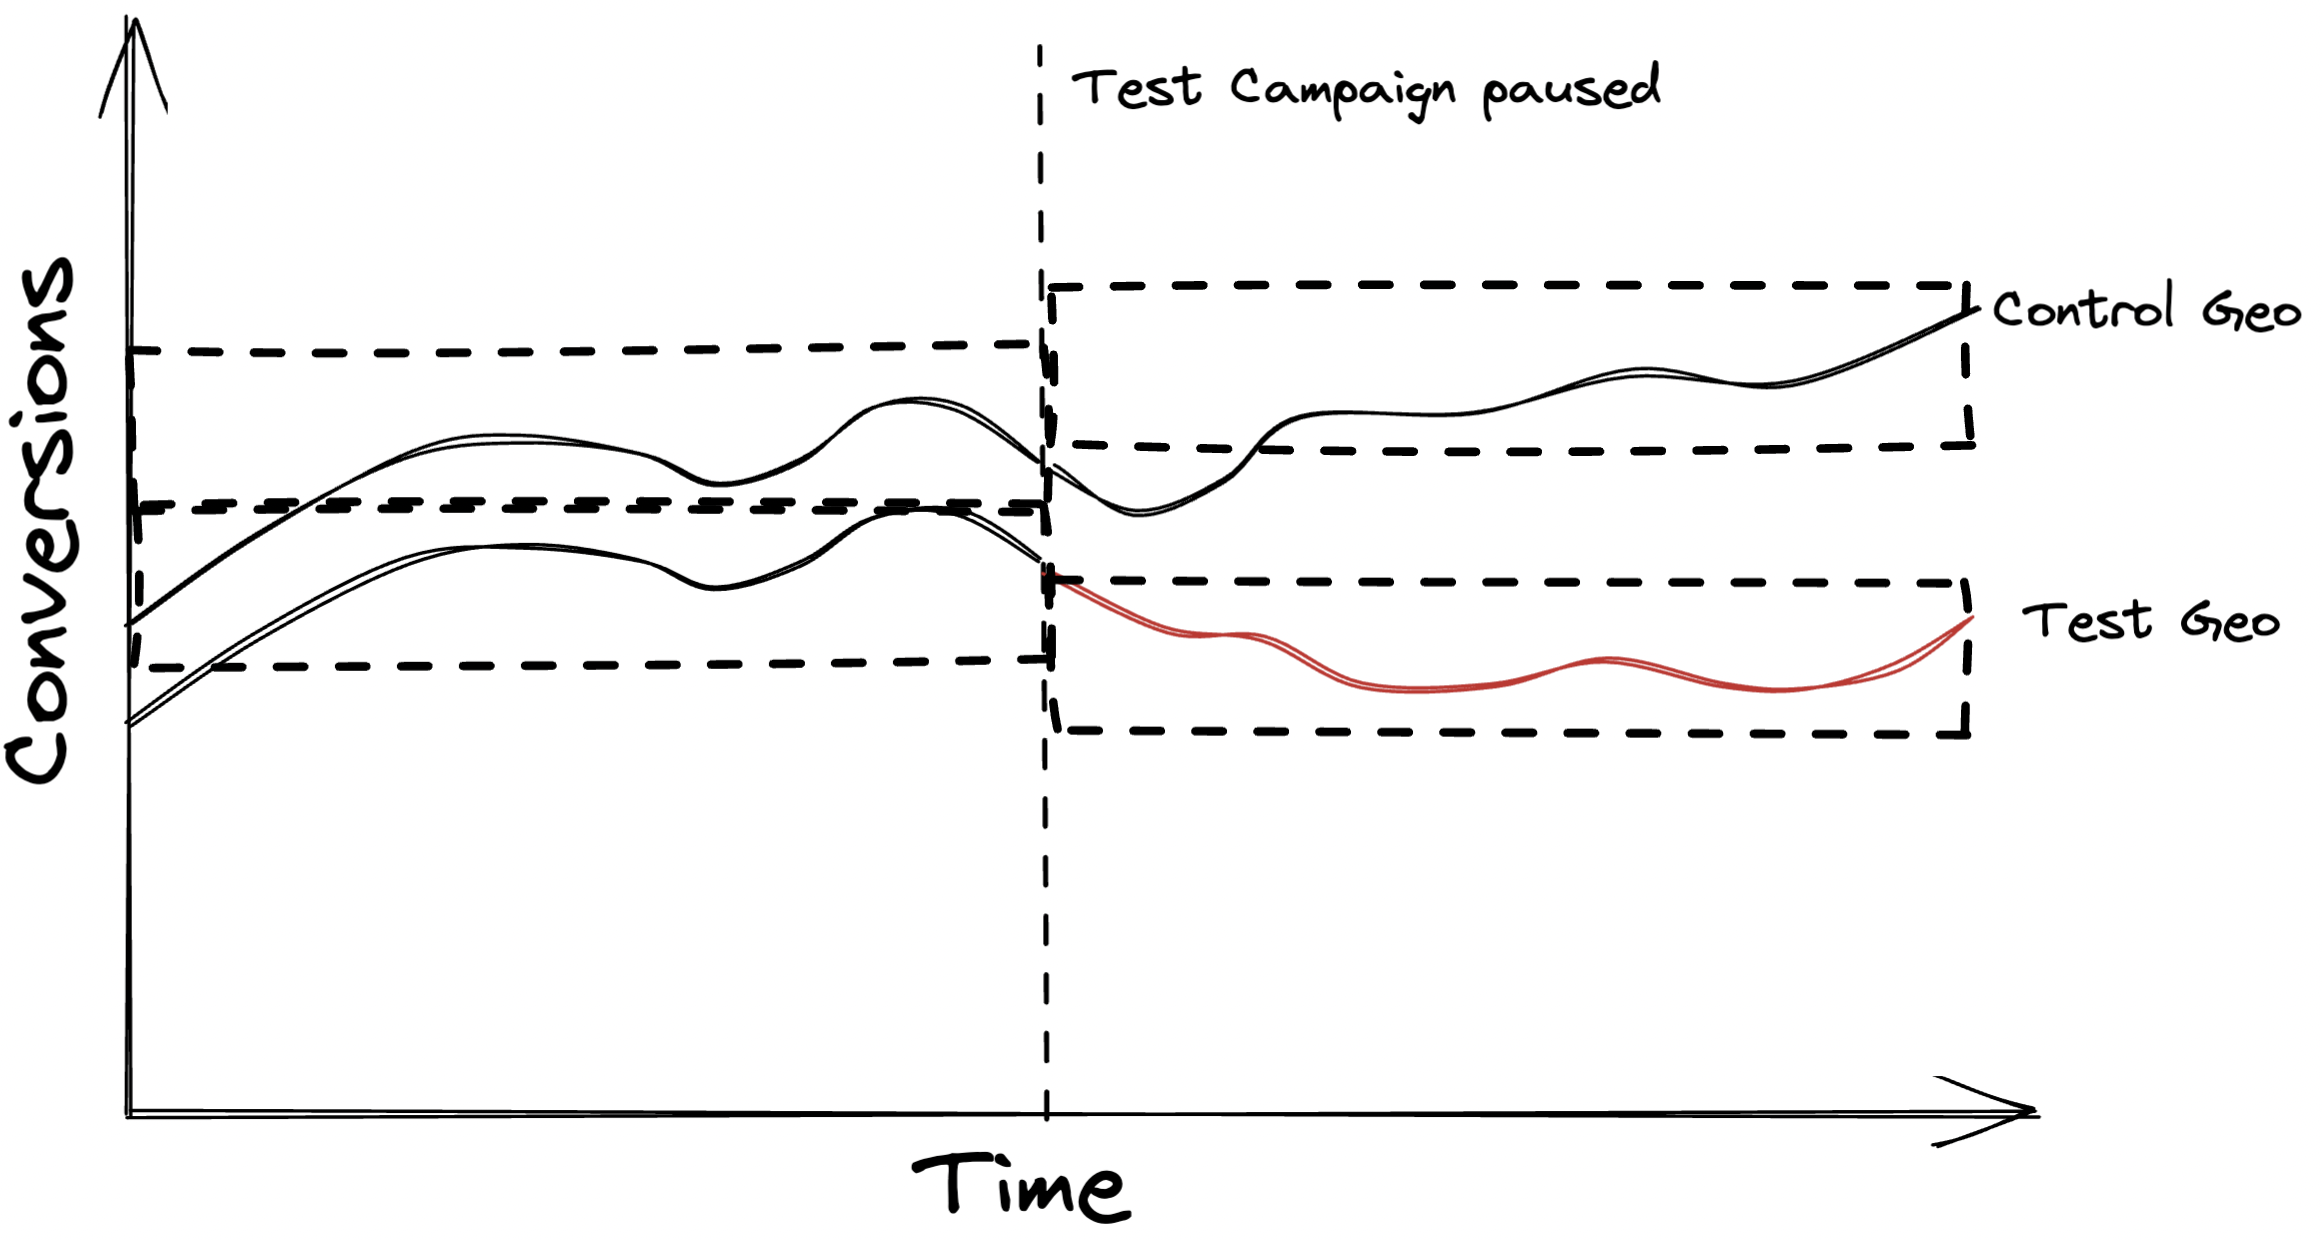 Difference in differences
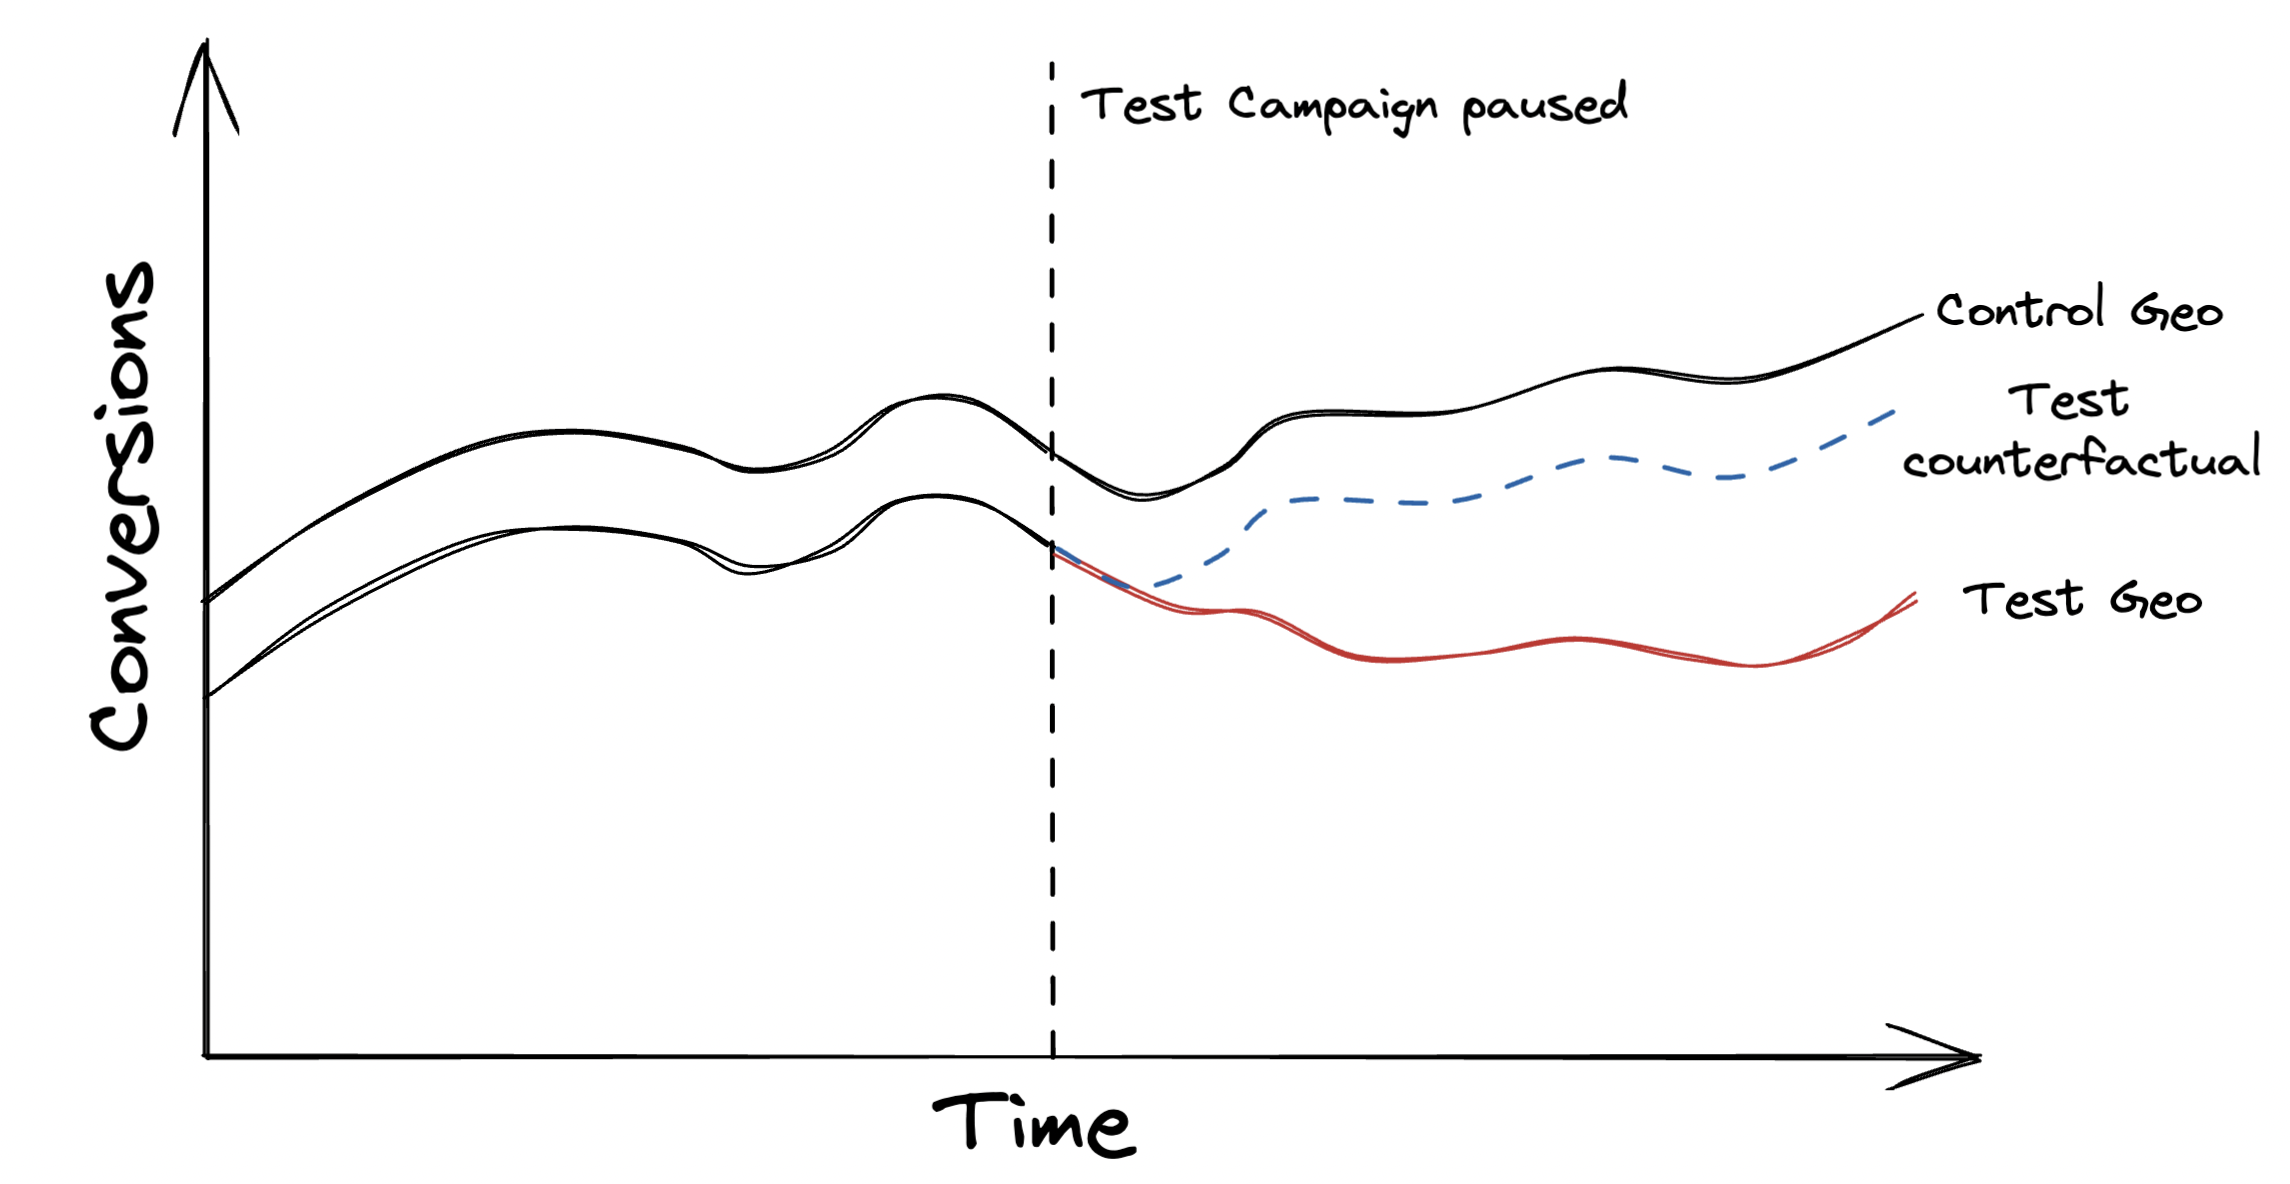 Causal impact
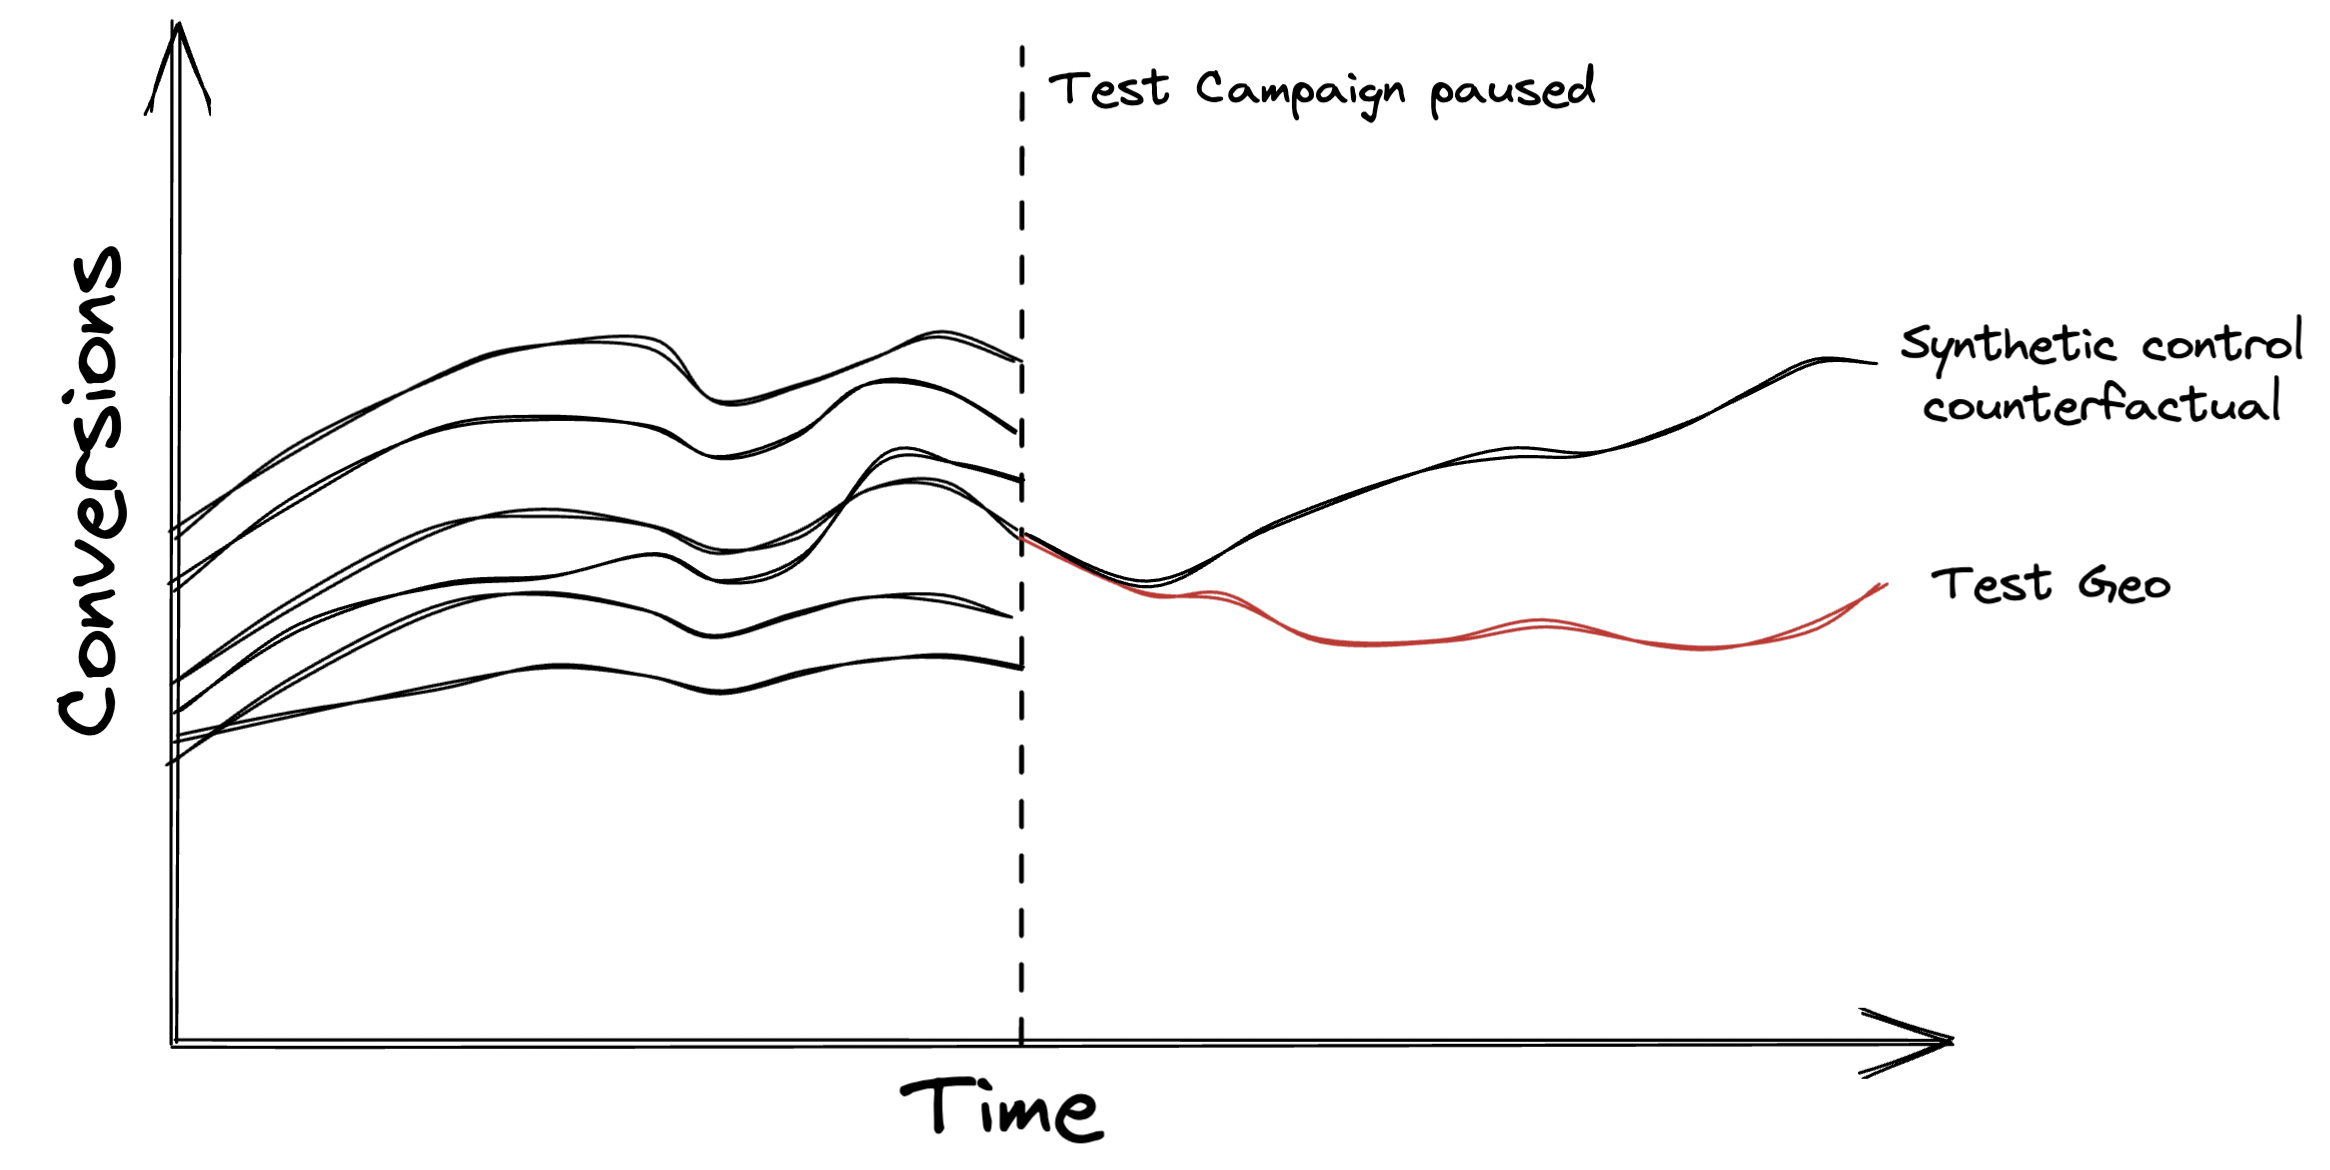 Synthetic control
 A campaign with an on-off test
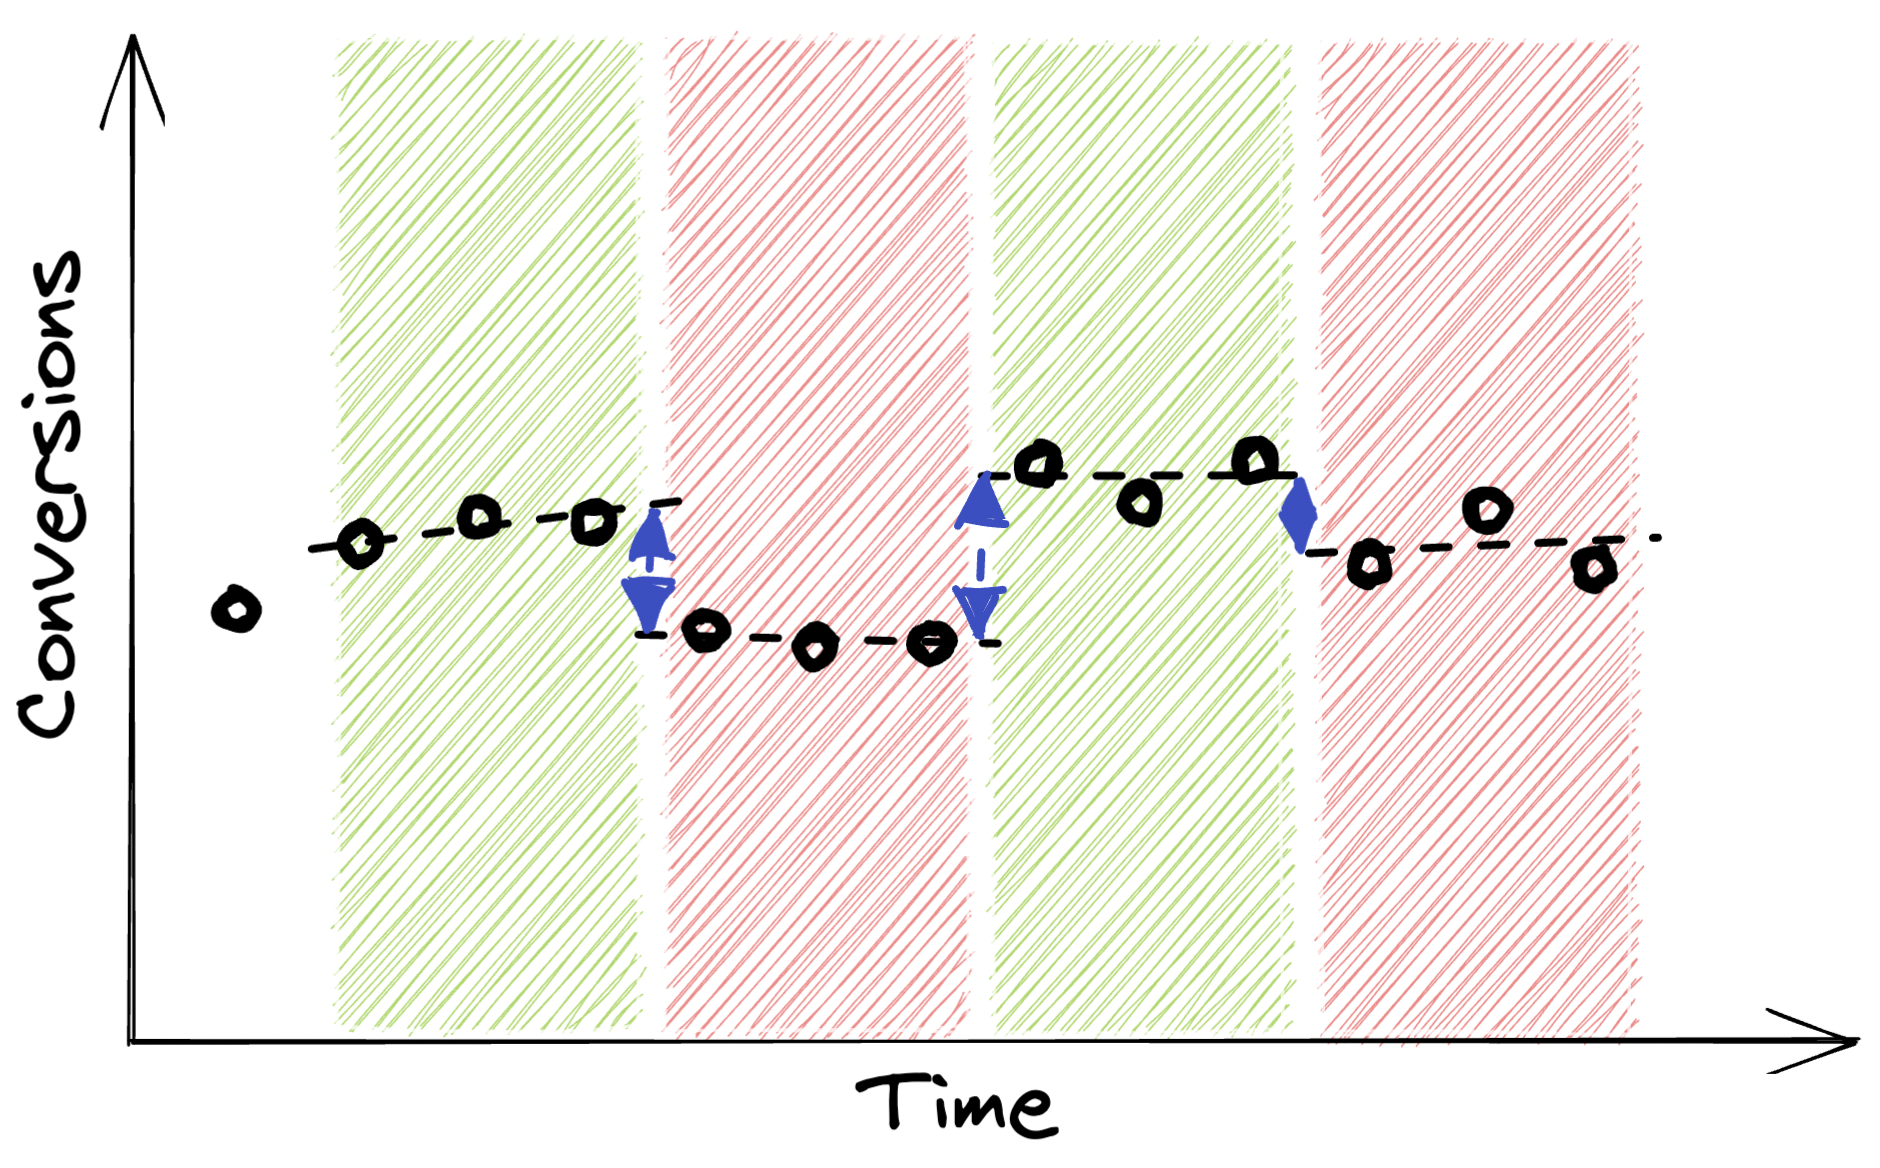
The last method we’ll look into can be called an on-off test. In this design we flick a campaign on and off over a period of time to gather many data points with the campaign on and off as possible - often this will be mean having the campaign on for one hour, off for the next hour and so on, often for a distinct period through the day. Here we are only aiming to estimate the short term impact - anything outside of the one hour periods where the campaign is off isn’t looked at.
This type of test is effective in that it can operate in a situation where the above two methods aren’t feasible:
Tests with this design spend less time in a test period than the other designs so may need to be run over a longer period - however any loss in conversions is minimised (in the case where the campaigns have a high incrementality). The impact on impression share is also lower, making it less likely that a competitor will change their behaviour as a result of the test.
Once the test has completed, you will have a dataset of conversions for periods in which a campaign is on and off. There are a couple of ways to analyse this:
 Basic comparison of results
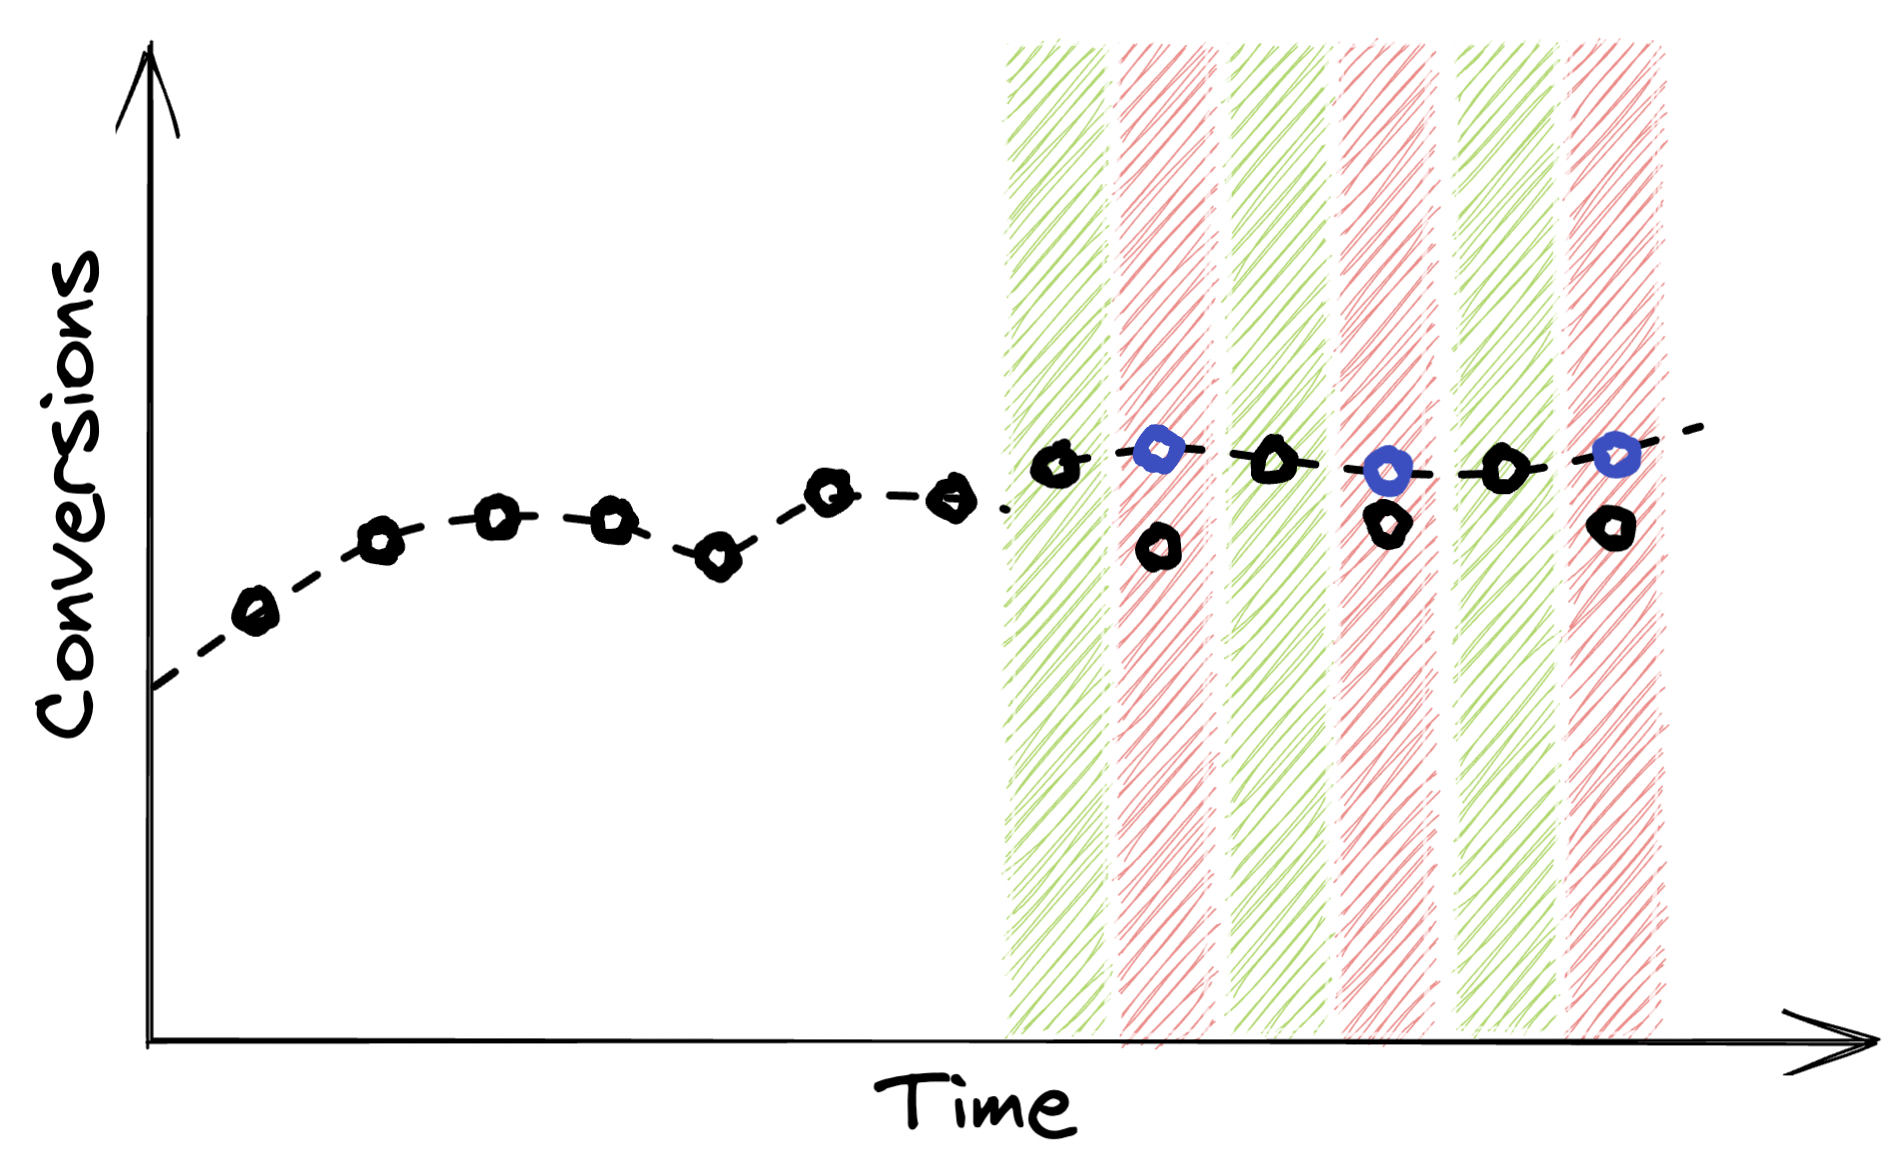 Interpolation
 Regression discontinuity design
By this point in the article you should have a good idea of which kind of test will work for your circumstances. Our aim with this article was to give you an overview into each method of testing - we’ve purposefully avoided adding practical guides to the more technical analyses on here as this would lead to an unreasonably long post. There are many ways to execute tests with each of the designs, both for technical and non-technical marketers. Practical guides and code examples for the above exist and are updated regularly so I encourage you to Google for these terms to find the latest approaches.
If you want to get a head start on any of these methods by having a test set up for you, we offer all of the test design, execution and analyses as a service. We are also building an app to enable fast and effective geo and on-off brand incrementality test setup and execution - join our waitlist for more details.
Are your brand search campaigns becoming more expensive? You’re not the only one 2022 has seen skyrocketing CPCs …
Our app is currently in a closed beta. To ensure the quality of each test, we’re opening our test to just a handful of users at a time. Signup using the link below to join the waitlist and get more info